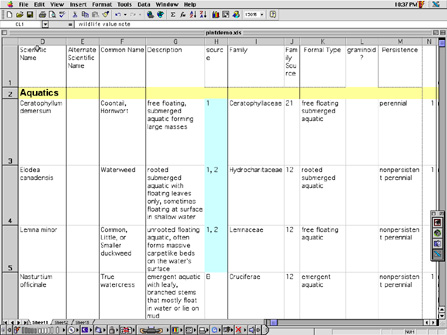
The chart to the right is a screen capture from the spreadsheet version
of the data.
The web-based database version will be able to relate the tens of
different data components to one another within a particular species.
And users will be able to make these relationships dynamically. Most
importantly the database will allow relationships between species.
It differs from other databases because it contains characteristics
that not only biologists and hydrologists need but also characteristics
critical to those who plan and design physical landscapes.
To see a more complete listing of data values,
activate chart. |